Abstract: Lift check valves are designed to prevent backflow and are valued for their simplicity and reliability. In valve production, the first-pass yield is a critical measure of quality. This study, grounded in Total Quality Management (TQM) and the Six Sigma DMAIC framework, established a quality control team and optimized the production process through the PDCA cycle. The valve design was improved by replacing the conical sealing surface with a spherical one to enhance fit accuracy, while additional protective measures were introduced during production. As a result, the first-pass yield increased from 62.3% to 97.41%. This study provides a practical reference for improving first-pass yield, enhancing product quality, and reducing costs in similar manufacturing processes.
Lift check valves are essential components in modern fluid systems. With their simple structure and dependable sealing performance, they are widely applied in industries such as nuclear power, petrochemicals, and water conservancy. Their primary function is to prevent backflow, thereby ensuring the safety and stability of the system. However, increasingly stringent industrial performance requirements present significant challenges for both manufacturing and quality control. Studies indicate that fluid dynamics, seal design, and material selection have a direct impact on valve stability, while even minor production deviations may compromise performance and system reliability. In production, the first-pass yield—defined as the percentage of products that pass factory tests such as airtightness and flow resistance on the first attempt—is a key quality metric. Low first-pass yields can increase rework or scrap costs by 10%–30% and may cause delivery delays. For nuclear-grade valves, where testing standards are stringent, low first-pass yields represent a substantial safety and economic risk. Enhancing first-pass yields is thus critical not only for quality improvement but also for minimizing costs and maximizing efficiency. Current research on manufacturing quality primarily emphasizes technological innovations and process improvements, such as optimizing flow characteristics via fluid-structure interaction simulations or applying quality control methods to improve the pass rates of welded structures. However, individual technological solutions are often insufficient to tackle complex manufacturing challenges; integrating them with scientific management approaches is essential for comprehensive process optimization. The PDCA cycle, a continuous improvement methodology, systematically identifies and eliminates quality defects through structured problem analysis, implementation of solutions, and subsequent verification. For instance, the combination of Six Sigma DMAIC and PDCA has substantially enhanced first-pass yields in welding and material preparation, with QC team–driven PDCA cycles raising UHPC panel installation yields to more than 97%. Although prior studies have examined structural design and testing methods for lift check valves, the systematic application of PDCA to enhance first-pass yields remains limited. Technically, computational fluid dynamics (CFD) and fluid-structure interaction analyses can quantify disc stress and underscore the pivotal role of seal design in determining performance. However, some advanced techniques involve high risks and are less practical for industrial application. From a management perspective, the DMAIC framework offers a solid theoretical foundation, while QC teams provide a practical and straightforward tool for implementation. In line with total quality management principles, this study utilizes a cross-functional QC team and incorporates critical failure modes from hermetic seal testing to execute the PDCA cycle, concentrating on seal structure optimization, workforce skill development, and production process standardization. This approach creates a reusable framework for quality improvement, offering both theoretical guidance and practical reference for high-precision valve manufacturing.
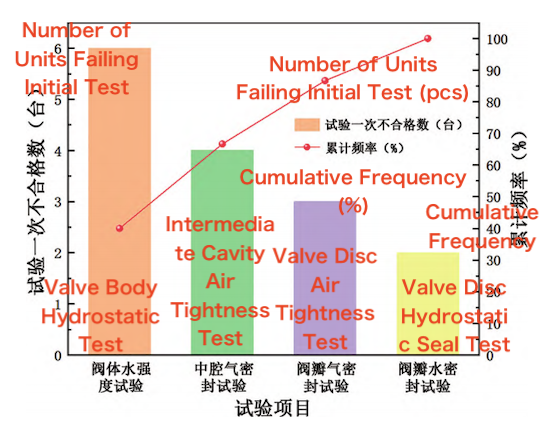
To address the low first-pass yield observed during initial testing of lift check valves within the delivery schedule, we first analyzed the timing of nonconformities in the manufacturing process of the first batch of 77 valves. These nonconformities were categorized and analyzed. It was found that early-stage nonconformities were intercepted and reworked, while products reaching the testing phase accounted for 70% of all nonconforming units. A statistical analysis of these nonconformities observed during testing is shown in Figure 1.

Figure 1: Classification and statistics of nonconformities for the first batch of lift check valves
Analysis showed that the disc airtightness test was responsible for the majority of test failures (79.31%). The first-pass pass rate can be calculated as follows:
First-time pass rate=[(77−23)×(1+27.9%)+(77−4)+(77−1)+(77−1)]/477=95.47%
This suggests that if the disc airtightness pass rate were raised to 98%, the overall first-pass yield would reach 95.47%. Consequently, a detailed analysis of the airtightness test was carried out. Using Delphi and brainstorming methods, ten potential factors contributing to disc airtightness test failures were identified. A factor identification plan was then applied to evaluate each factor individually, ultimately confirming three key contributors:
- Unreasonable design of the sealing substructure
- Inadequate manufacturing process for the plug
- Insufficient protective measures during handling and transfer
Using QC team management methods, factor identification highlighted three key factors along with their corresponding improvement targets. The sealing substructure was redesigned, the component manufacturing process was revised, and protective measures for handling and transfer were implemented. To further analyze issues with the secondary sealing structure, first-pass factory test rates were collected and compared for valves with similar designs—general-purpose globe valves and Type B (Z-type) globe valves—produced and stored from October to December of the previous year, as shown in Table 1.
Table 1. First-Pass Factory Test Rates for Valves with Similar Structures
|
Valve Type |
October |
November |
December |
Total |
First-Pass Rate (%) |
|
General-purpose globe valves |
358 / 356 |
267 / 264 |
206 / 202 |
831 / 822 |
98.92 |
|
Z-type globe valves |
245 / 243 |
216 / 215 |
198 / 195 |
659 / 653 |
99.09 |
The comparison indicates that first-pass rates for general-purpose and Z-type globe valves—both featuring similar structures—are significantly higher than those of lift check valves. A comparative analysis of the structure and testing requirements of lift check valves, general-purpose globe valves, and Z-type globe valves indicates that valves with similar structures have an average first-pass rate of 99%. A notable feature of these valves is their spherical disc sealing surface, which promotes the formation of a reliable sealing pair. Based on this insight, the lift check valve’s sealing pair structure was modified accordingly.
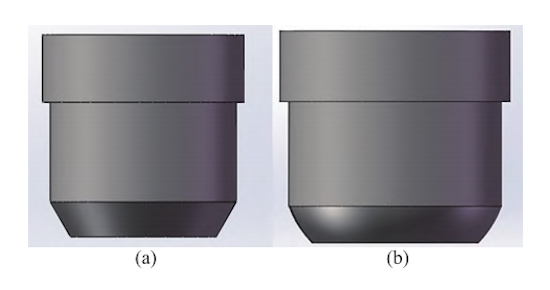
The disc structure is a key factor influencing the first-pass rate in valve testing. In a conical seal, the angle is fixed, necessitating a precise fit between the valve body and the disc. Minor issues—such as scratches on the sealing surface, angular deviations, or machining tolerances—can all result in conical seal failure. Ideally, the conical seal should operate as a face seal, but this is not practically feasible. In addition, the high level of machining precision required complicates production and leads to a low first-pass rate. By contrast, a spherical disc sealing against a conical valve body only requires that an annular band on the spherical surface forms a functional sealing pair. This spherical design effectively overcomes the manufacturing challenges associated with the sealing pair. Consequently, the disc structure was modified, and the corresponding drawings and process routing cards were updated. For verification, the conical surface was replaced with a spherical surface, as shown in Figure 2.

Figure 2 Comparison of Sealing Surfaces
(a) Conical disc structure (b) Spherical disc structure
The manufacturing process for the valve body and disc was thoroughly reviewed. The original sequence was: printing and cleaning → storage → part machining → grinding → full-surface PT → packaging → cleaning and drying → testing → fitting → assembly. After grinding, the sealing surfaces of the valve body and disc were intact and met the required roughness. However, subsequent steps—including full-surface PT, cleaning, storage, fitting, and assembly—increased the risk of dimensional deviations on the sealing surfaces. A spot check of 10 valve bodies and 10 valve discs at the assembly site revealed a significant number of substandard seals, as summarized in Table 2.
Table 2. Valve Body and Disc Sealing Surface Quality Record
|
Serial Number |
Part Name |
Sealing Surface Condition |
Conclusion |
Serial Number |
Part Name |
Sealing Surface Condition |
Conclusion |
|
1 |
Valve Body |
Intact |
Acceptable |
1 |
Valve Seat |
Scratched |
Unacceptable |
|
2 |
Valve Body |
Scratched |
Unacceptable |
2 |
Valve Seat |
Scratched |
Unacceptable |
|
3 |
Valve Body |
Intact |
Acceptable |
3 |
Valve Seat |
Intact |
Acceptable |
|
4 |
Valve Body |
Intact |
Acceptable |
4 |
Valve Seat |
Scratched |
Unacceptable |
|
5 |
Valve Body |
Scratched |
Unacceptable |
5 |
Valve Seat |
Damaged |
Unacceptable |
|
6 |
Valve Body |
Damaged |
Unacceptable |
6 |
Valve Seat |
Intact |
Acceptable |
|
7 |
Valve Body |
Intact |
Acceptable |
7 |
Valve Seat |
Scratched |
Unacceptable |
|
8 |
Valve Body |
Intact |
Acceptable |
8 |
Valve Seat |
Scratched |
Unacceptable |
|
9 |
Valve Body |
Intact |
Acceptable |
9 |
Valve Seat |
Scratched |
Unacceptable |
|
10 |
Valve Body |
Intact |
Acceptable |
10 |
Valve Seat |
Scratched |
Unacceptable |
The inspection results indicate that 5 out of 10 valve body sealing surfaces and 7 out of 10 valve disc sealing surfaces were substandard. To address this issue, the manufacturing process was revised as follows:
Revised Process: Machining → Batch Number Printing → Grinding (Rough Lapping) → PT of All Accessible Surfaces → Warehousing → Kitting → Cleaning → Fine Lapping, Matching, and Polishing of Valve Body and Disc Sealing Surfaces → PT of Sealing Surfaces → Cleaning and Drying → Assembly → Testing → Seal Welding (if any) → PT of Weld Seams (if any) → Cleaning and Drying → Packaging
During the identification of key factors, it was observed that collisions occurring during part handling significantly compromised the quality of the sealing surfaces. A review of relevant process documents revealed that no protective measures were specified for the valve body or disc sealing surfaces during handling. On-site spot checks were then conducted, and the protection status of the sealing surfaces is summarized in Table 3.
Table 3. Protection of Valve Body and Disc Sealing Surfaces
|
No. |
Spot-Checked Part |
Process Description |
Sealing Surface Protection Location |
|
1 |
Valve Disc |
Inspection Station After Grinding |
None (No pallet) |
|
2 |
Valve Body |
Grinding Station After Machining |
None (No pallet) |
On-site inspection revealed that valve bodies and discs were left unprotected during cleaning and assembly testing. Additionally, multiple discs were stacked together in a transfer box. During forklift handling, collisions occurred, resulting in dents and scratches on the disc sealing surfaces, which caused failures in the disc airtightness test. A set of discs was retrieved from the grinding area and transported in a transfer box to the nondestructive testing area. Re-inspection revealed that four discs exhibited varying degrees of dents and scratches on their sealing surfaces. To minimize such damage, additional protective measures have been implemented based on the actual manufacturing process. Disc sealing surfaces must now be stored in dedicated, foam-lined boxes during handling to prevent collisions between components.
To verify the impact of the seal assembly structural modification, disc seal assemblies were re-manufactured in accordance with the new drawings and process requirements. The disc machining process was closely monitored to ensure both machining accuracy and adherence to the production schedule. Following these improvements, the disc seal test was repeated, and valve leakage rates were measured. The results are summarized in Table 4. All valve performance test records passed, and the disc seal test leakage rates met the specified requirements. This demonstrates that the spherical seal assembly effectively ensures a high pass rate in the disc airtightness test and enhances the overall first-pass rate in the valve factory test.
Table 4. Valve Performance Test Record
|
Serial Number |
Sealing Surface Condition |
Conclusion |
|
1 |
Intact |
Passed |
|
2 |
Intact |
Passed |
|
3 |
Intact |
Passed |
|
4 |
Intact |
Passed |
|
5 |
Intact |
Passed |
|
6 |
Intact |
Passed |
|
7 |
Intact |
Passed |
|
8 |
Intact |
Passed |
|
9 |
Intact |
Passed |
|
10 |
Intact |
Passed |
Following the process adjustments, on-site inspection results improved significantly. No product batches were found to have unqualified sealing surfaces caused by process-related issues. Details are provided in Table 5. This confirms that the process adjustments effectively resolved the issues affecting the quality of the valve body and disc sealing surfaces.
Table 5. Valve Body and Disc Sealing Surface Quality Record
|
No. |
Part Name |
Sealing Surface Condition |
Conclusion |
|
1 |
Valve Body |
Intact |
Passed |
|
1 |
Valve Seat |
Intact |
Passed |
|
2 |
Valve Body |
Intact |
Passed |
|
2 |
Valve Seat |
Intact |
Passed |
|
3 |
Valve Body |
Intact |
Passed |
|
3 |
Valve Seat |
Intact |
Passed |
|
4 |
Valve Body |
Intact |
Passed |
|
4 |
Valve Seat |
Intact |
Passed |
|
5 |
Valve Body |
Intact |
Passed |
|
5 |
Valve Seat |
Intact |
Passed |
|
6 |
Valve Body |
Intact |
Passed |
|
6 |
Valve Seat |
Intact |
Passed |
|
7 |
Valve Body |
Intact |
Passed |
|
7 |
Valve Seat |
Intact |
Passed |
|
8 |
Valve Body |
Intact |
Passed |
|
8 |
Valve Seat |
Intact |
Passed |
|
9 |
Valve Body |
Intact |
Passed |
|
9 |
Valve Seat |
Intact |
Passed |
|
10 |
Valve Body |
Intact |
Passed |
|
10 |
Valve Seat |
Intact |
Passed |
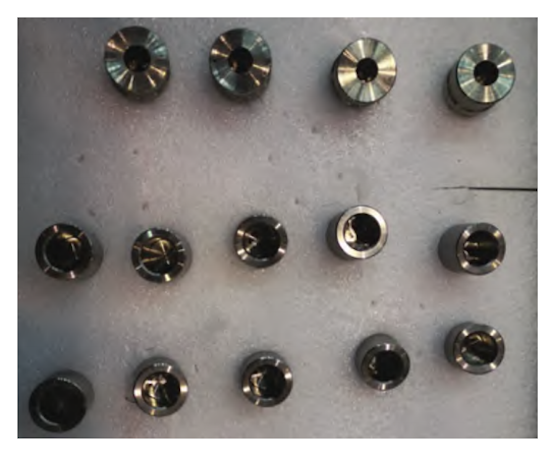
After implementing the turnover protection requirements, random inspections were conducted at the cleaning and grinding stations. The results showed that 100% of the valve discs complied with the turnover protection measures. Ten valve discs were sampled for sealing surface inspection, and all passed. Inspections at the cleaning stations confirmed that operators fully adhered to the dedicated turnover box requirements, ensuring complete protection of the disc sealing surfaces (see Figure 3).

Figure 3. Valve Disc Turnover Protection Sealing Surface Inspection Results
After implementing the improvement measures, subsequent lift check valves were tested as scheduled. Tracking statistics for the second batch of 580 valves showed that the first-pass rate for factory tests increased to 97.41%, up from 62.3% before the improvements. This exceeds the target first-pass rate of 95%. To evaluate the effectiveness of the countermeasures, first-pass failure statistics for the second batch were collected. The results are presented in Figure 4 and Table 5. Analysis indicates that failures in the valve disc airtightness test were significantly reduced following the implementation of the improvements. Compared with the pre-improvement first-pass rate of 62.8%, the potential first-pass failure rate was reduced by 34.6%.
Table 5. Single Test Failure Rate Statistics for Lift Check Valve Tests
|
No. |
Test Item |
Total Tests (Units) |
Test Failures (Units) |
Failure Rate (%) |
Cumulative Frequency (%) |
|
1 |
Valve Body Water Strength Test |
580 |
6 |
1.03 |
40 |
|
2 |
Cavity Air Tightness Test |
580 |
4 |
0.69 |
66.67 |
|
3 |
Disc Air Tightness Test |
580 |
3 |
0.52 |
86.67 |
|
4 |
Disc Water Tightness Test |
580 |
2 |
0.34 |
100 |
These results confirm that the implemented measures—modifying the disc sealing structure, adjusting the manufacturing process, and enhancing turnover protection—effectively improved the first-pass rate and ensured consistent valve quality.
This study applied the PDCA approach to develop a plan, establish a QC team, and implement comprehensive quality management. This approach effectively and accurately identified the key issues in the production process. By implementing targeted measures—such as modifying the sealing surface structure, adjusting the process flow, and enhancing part protection—the first-pass rate of lift check valves increased by nearly 56.3%, significantly reducing the rework rate. These improvements enhanced the quality of the valve body and disc sealing surfaces, reduced labor requirements, increased customer satisfaction, and shortened delivery times. This approach provides a reusable technical framework for process control and targeted improvements in the manufacturing of similar equipment. Empirical results further demonstrate that spherical seals deliver more reliable, product-grade sealing performance. Overall, improving the first-pass rate has strategic significance for controlling production costs and increasing profits, providing valuable insights for other companies in the same industry.